Results Table
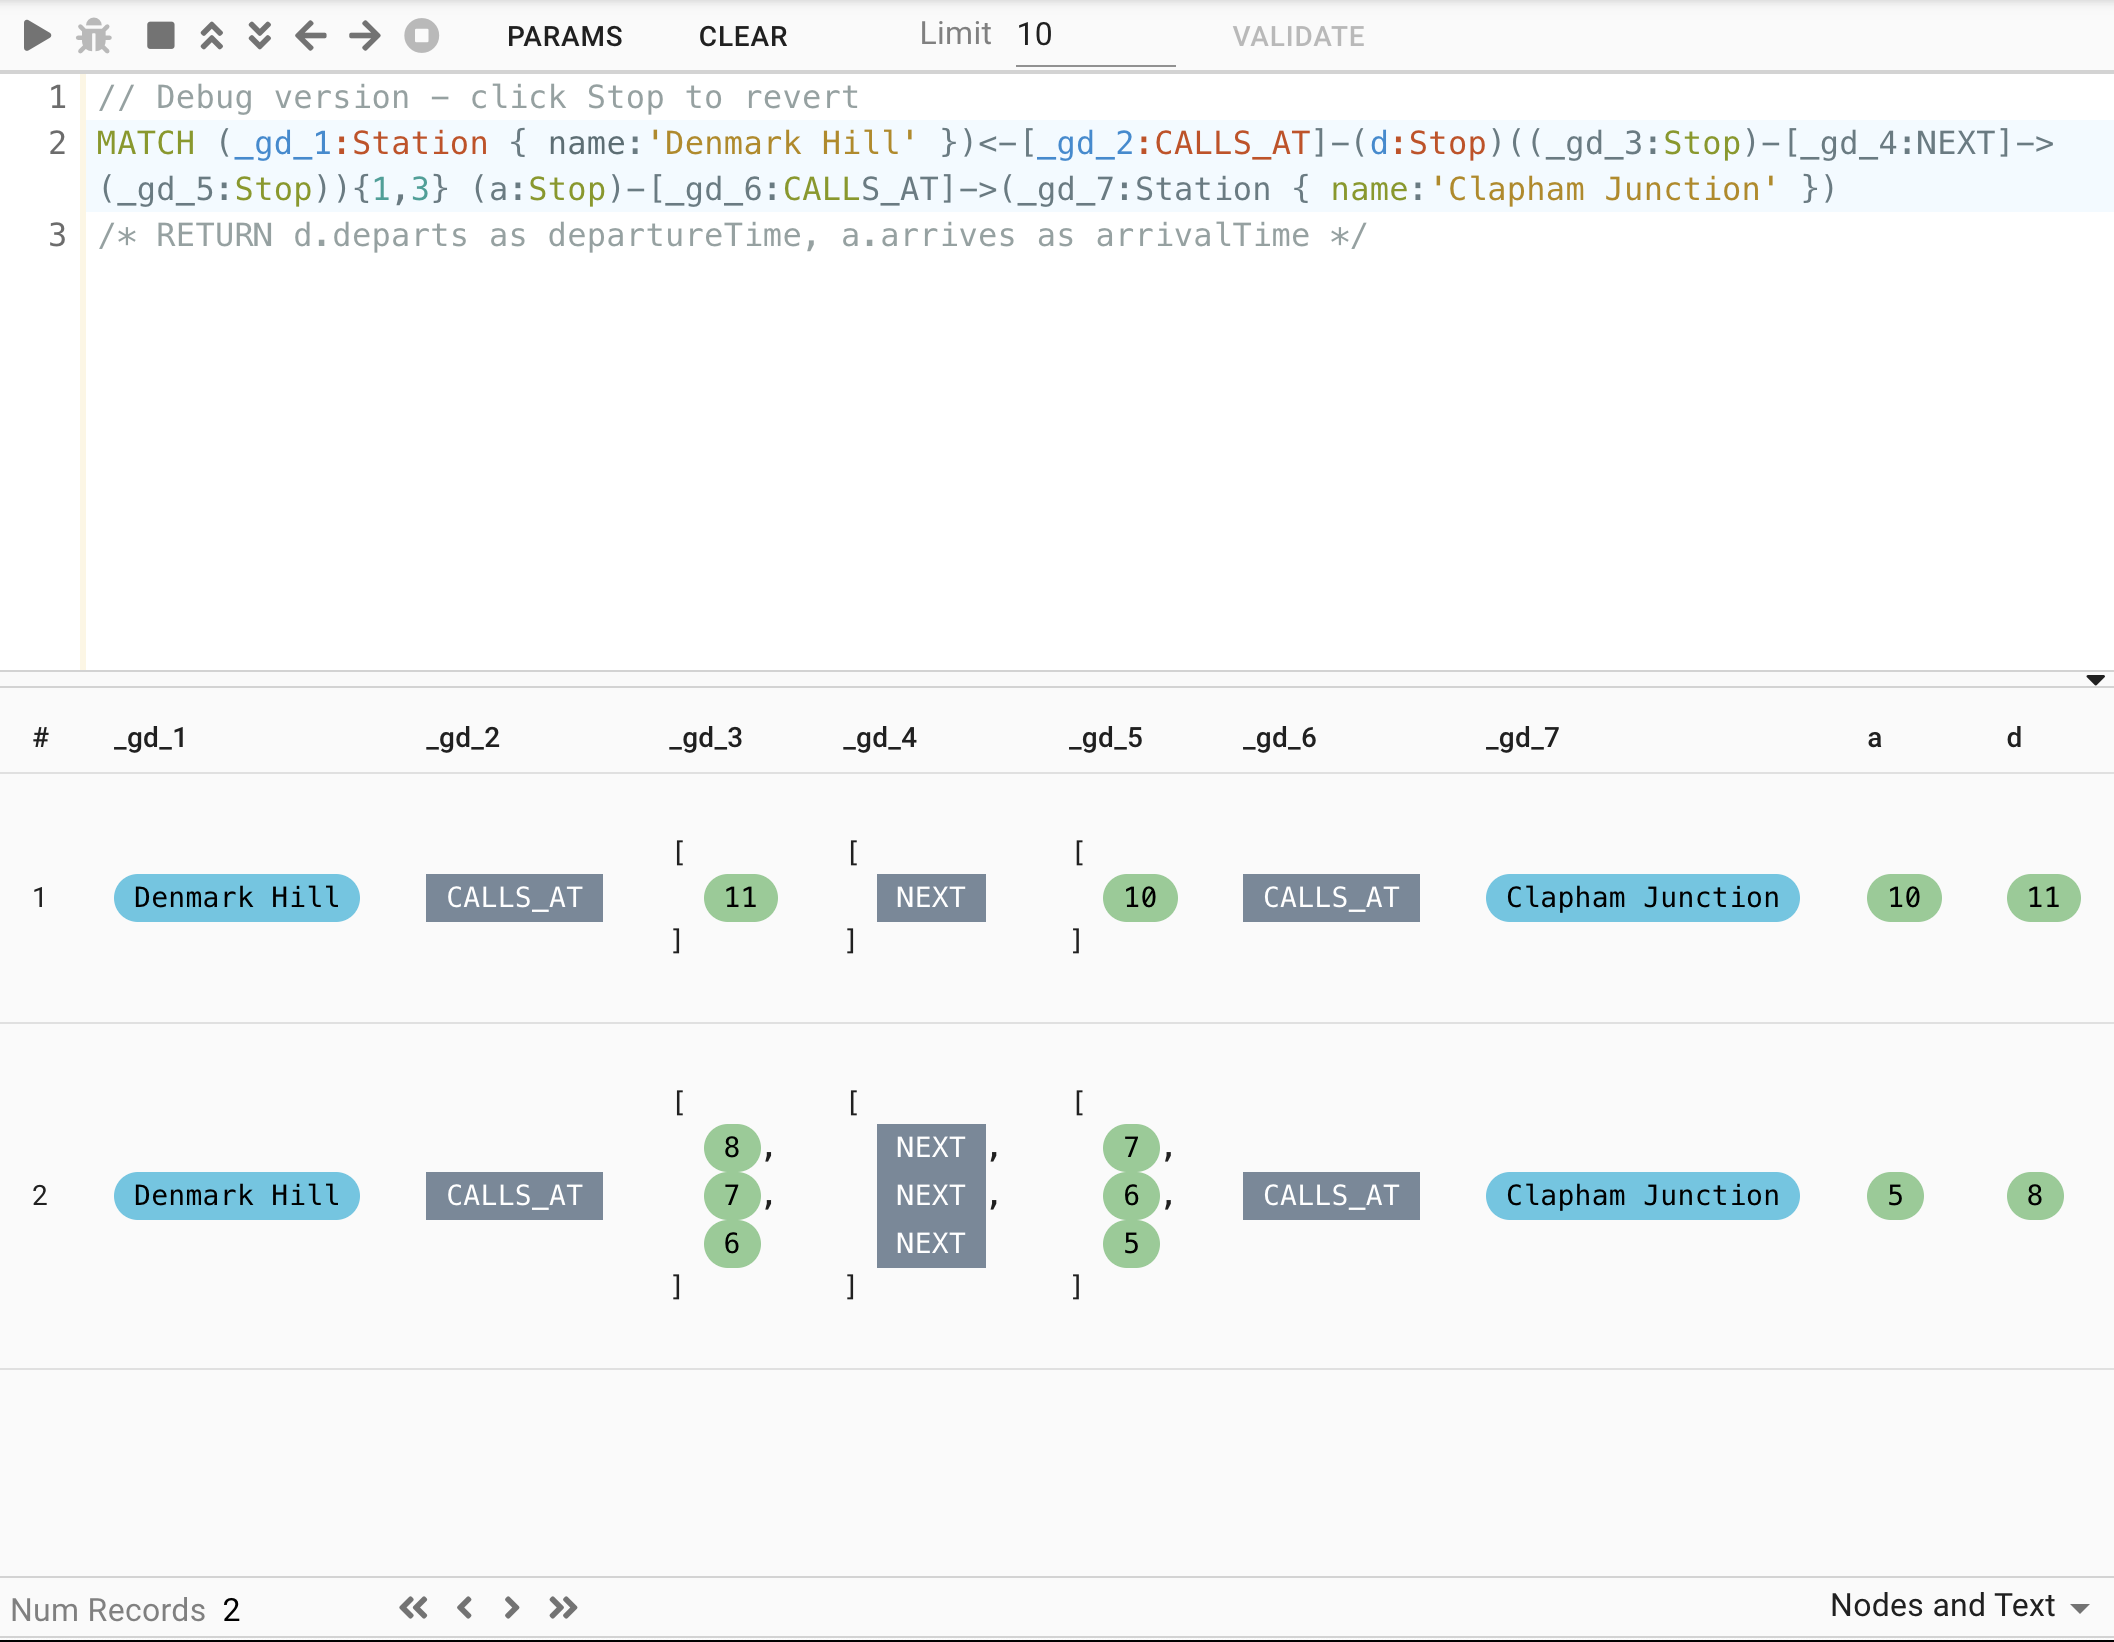
The Results Table shows all of the data returned from executing a Cypher query. As you step through a Cypher statement in Debug mode the rows for that specific step are shown in the Results Table. Unlike the Graph Visualization, there is no indicator to show which rows have changed from step-to-step.
The following image shows the results returned from the Cypher query Debug step in the Results Table:
Data Display
The type of data returned, along with the display mode determines how that specific of data is displayed. The following discusses the display for the Nodes and Text display mode:
-
Nodes: Nodes are shown as a colored bubble (rounded rectangle). Here a
Personnode with propertyname=Keanu Reeveshas been displayed. The color and display property are configurable.
-
Relationships: Relationships are shown as a gray rectangle. Here, the
ACTED_INrelationship is displayed. Unlike Nodes, the color and display property are not configurable.
-
Paths: Paths render the individual Nodes and Relationships using the appropriate configuration settings. The relationship directions are rendered with small arrows.

Here we have a path where the Person node Carrie-Anne Moss ACTED_IN The Matrix Movie node, and the same The Matrix Movie node traverses ACTED_IN in reverse to the Person node Keanu Reeves.
-
Lists: Lists are shown with an opening bracket (
[) and closed with a closing bracket (]). The individual values appear comma separated, one per line. Here the list ofMovienodes Keanu Reeves hasACTED_INis shown:
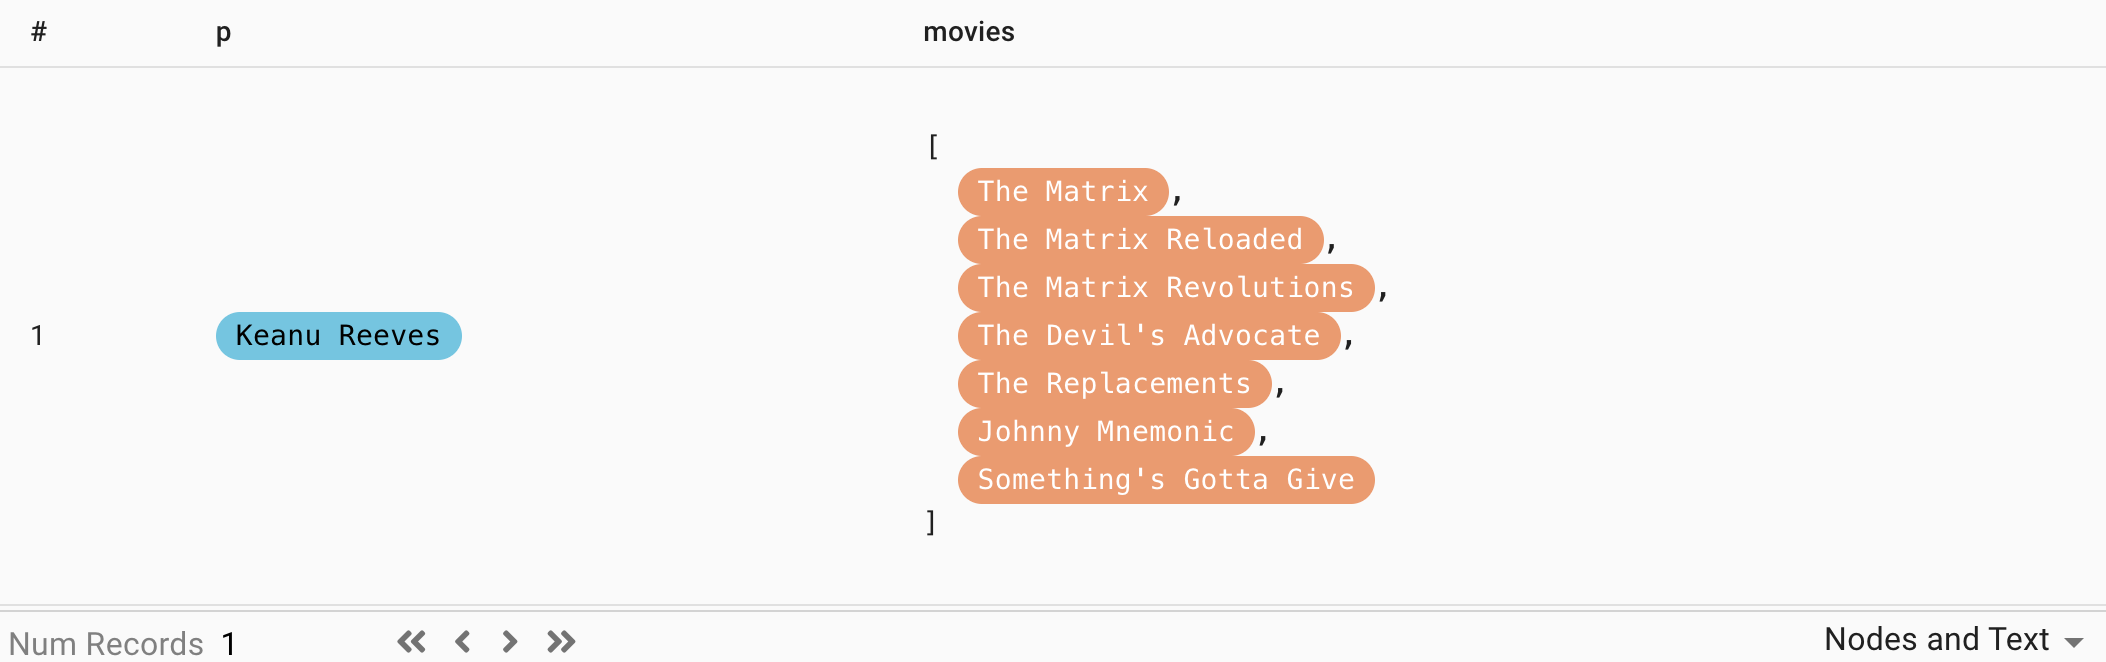
This is the query that resulted in the display above:
MATCH (p:Person {name:'Keanu Reeves'})-[r:ACTED_IN]->(m:Movie)
WITH p, collect(m) as movies
RETURN p, movies-
Maps: Maps are shown with an opening curly brace (
{) and closed with a closing curly brace (}). The image below shows a list of maps, wheremoviesandroleare the map keys, and the map values are a list ofMovienodes and theroleString value, respectively.
Note that we have returned person name now as a String value, so it is no longer displayed as a blue bubble.
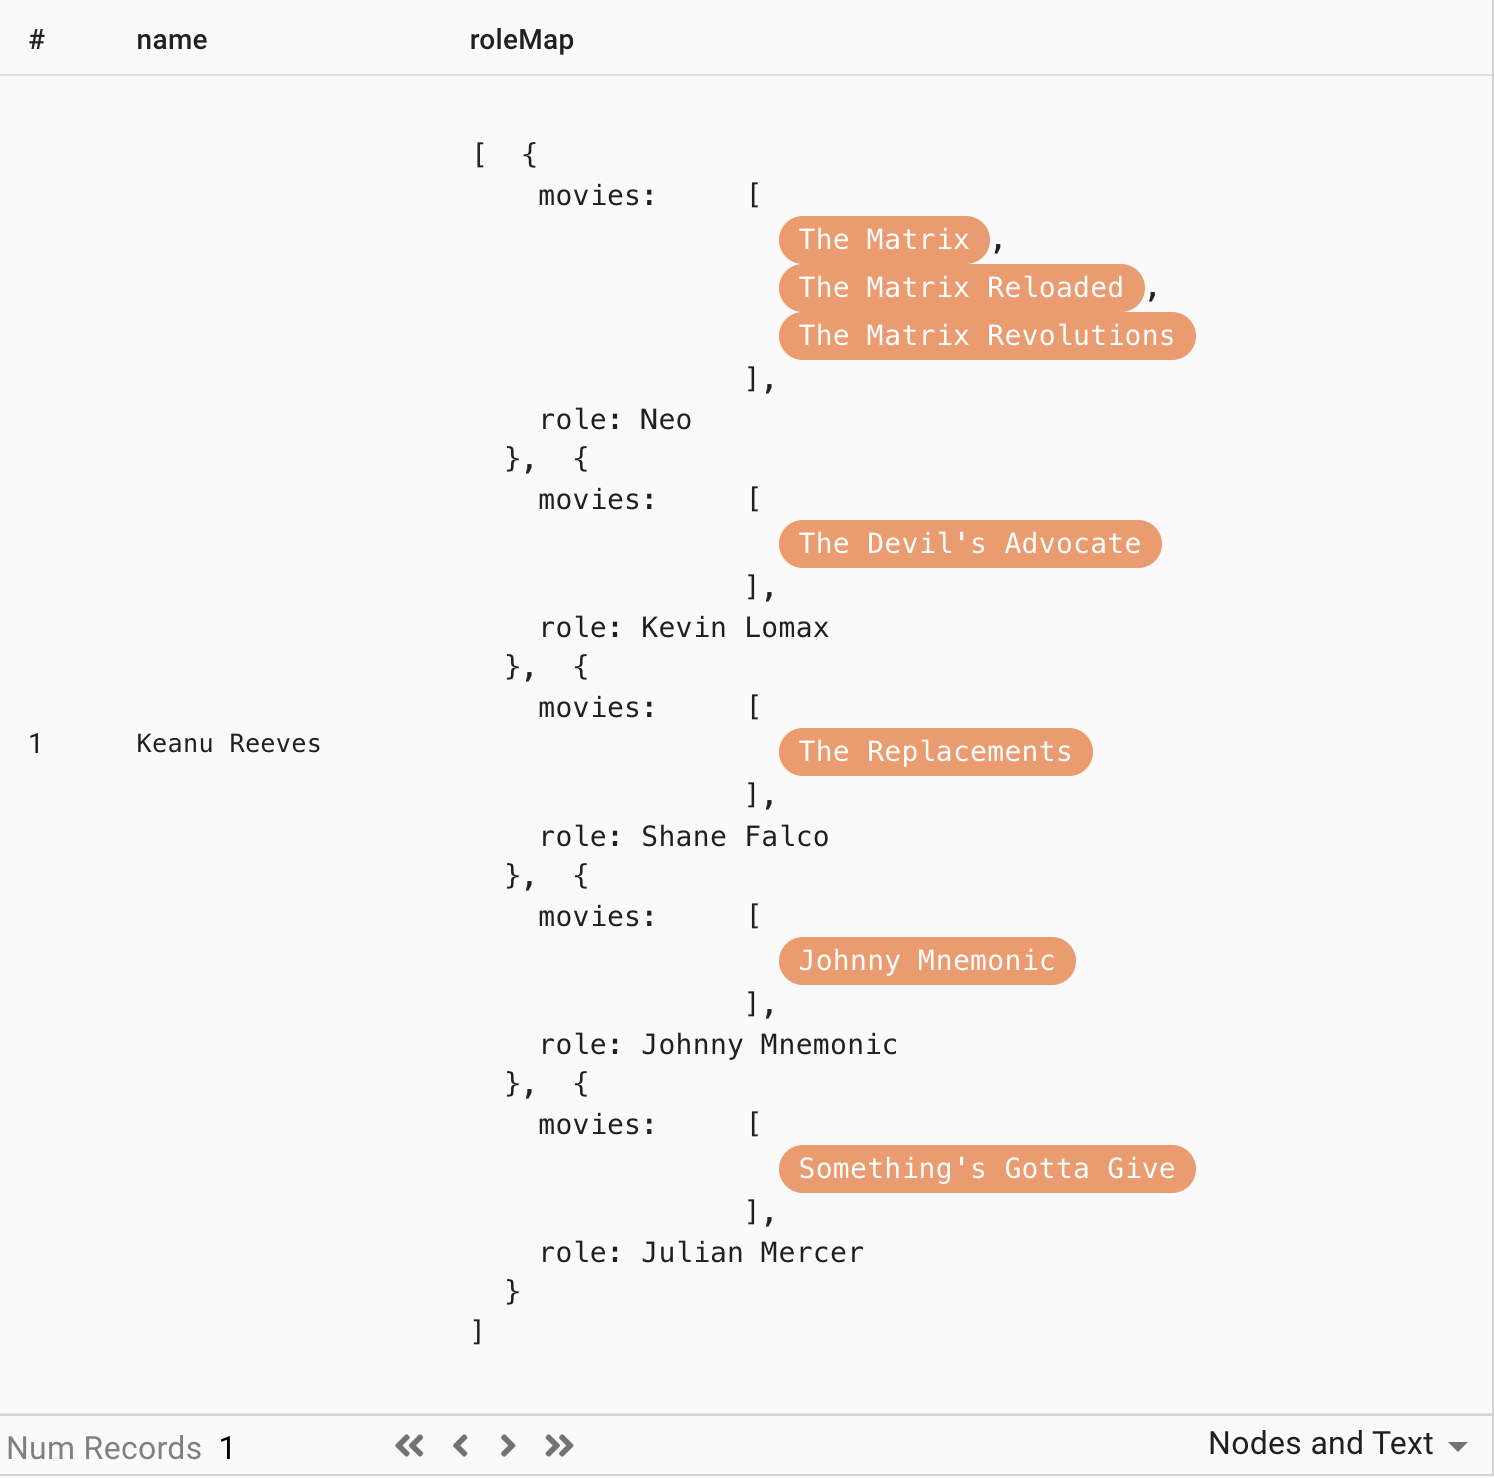
This is the query that resulted in the display above:
MATCH (p:Person {name:'Keanu Reeves'})-[r:ACTED_IN]->(m:Movie)
WITH p.name as name, r.roles as roles, m
UNWIND roles as role
WITH name, role, collect(m) as roleMovies
WITH name, collect({role: role, movies: roleMovies}) as roleMap
RETURN name, roleMap-
Other values: Scalar values such as Strings, Numbers, etc are displayed as they are returned from the Javascript driver. Sometimes, the driver serializes items to maps, such as
datetime.
Note: the color and display label for Nodes and Relationships can be changed. See Configure colors and labels for more information.
Toolbar
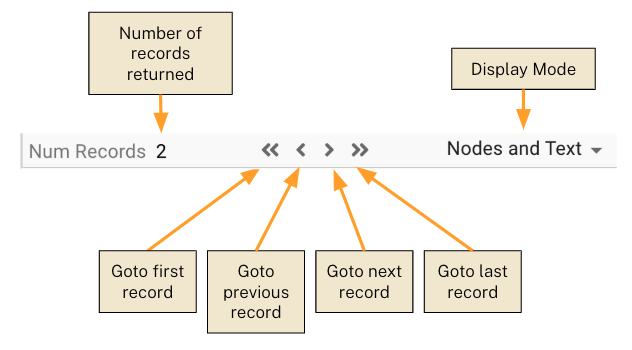
The Results Table has a Toolbar displayed at the bottom. The following diagram calls out each specific toolbar item:
-
Num Records: The number of records returned is displayed
-
Navigation:
-
Double left arrow: Goto the first record
-
Single left arrow: Goto the previous record
-
Single right arrow: Goto the next record
-
Double right arrow: Goto the last record
-
-
Display Mode: Change the Display Mode
Display Mode
Clicking Nodes and Text will show a picker providing three options. The options and the resulting layouts are shown here:

-
Nodes and Text: displays nodes, relationships, and paths in a compact graphical form. Maps, lists, and scalar values are shown with formatted whitespace.
-
Formatted Text: renders nodes, relationships, and paths as JSON maps. This view enables you to view the properties for nodes and relationships. Maps, lists, and scalar values are shown with formatted whitespace. This is similar to the Text view in Neo4j Browser.
-
Compact Text: same as Formatted Text except all whitespace is collapsed.
Row selection
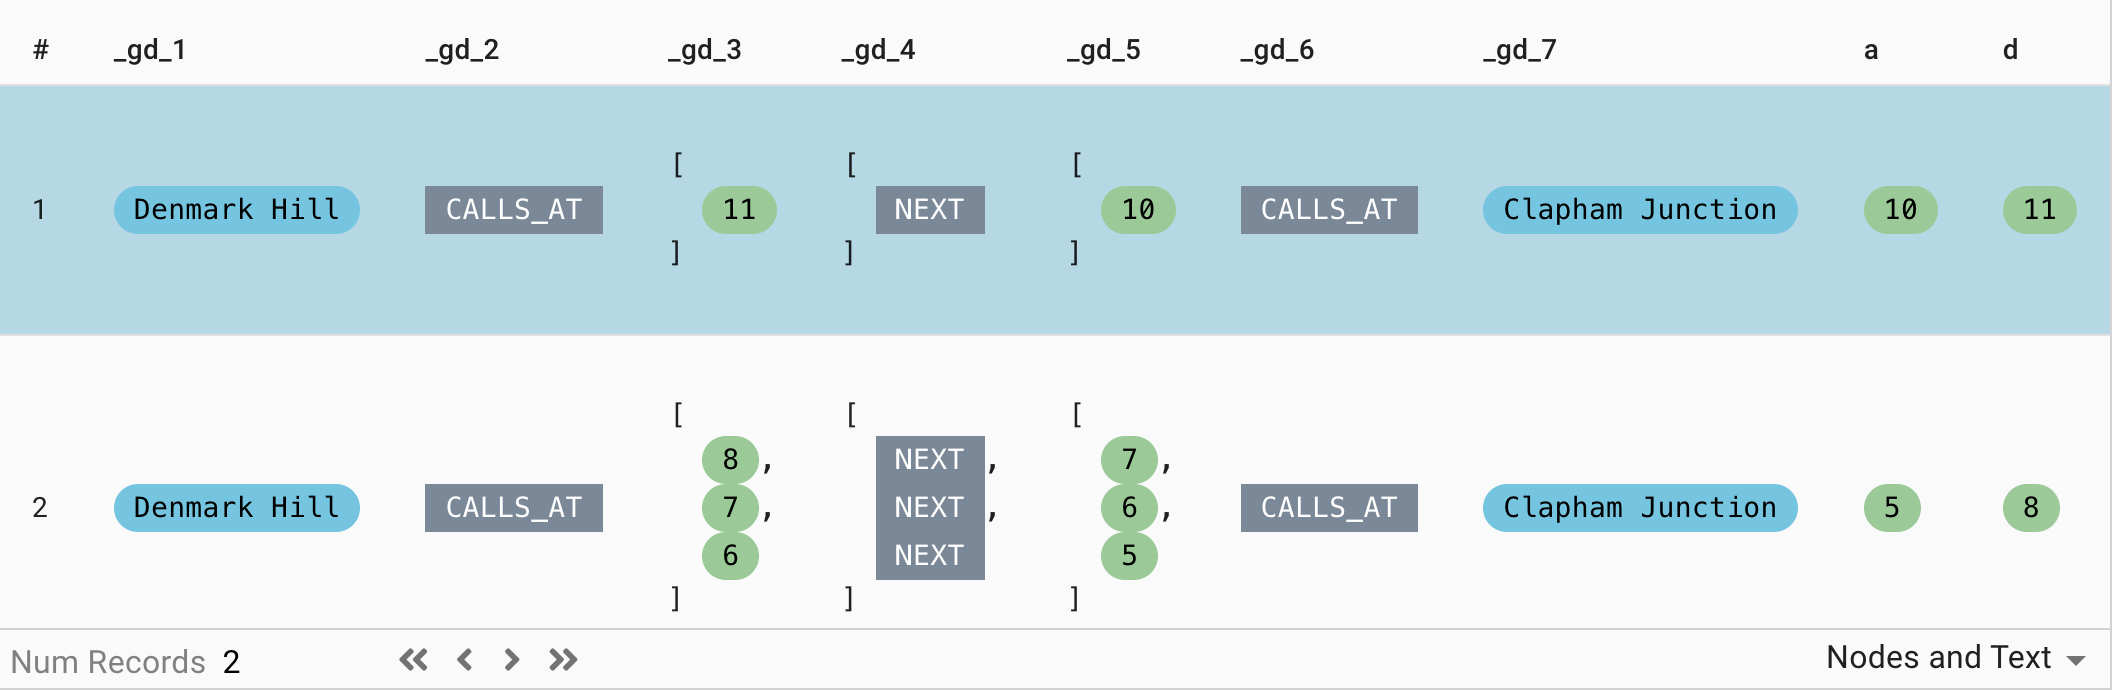
Rows can be selected in the Results Table. A selected Row will have a blue background. All nodes, relationships, and paths that are in that row will be selected in the Graph Visualization.
-
Select a row: Click on an unselected row
-
Deselect a row: Click on a selected row
-
Multi-select:
-
Contiguous select: With at least one row already selected, hold the
Shiftkey down and click on an unselected row. Any unselected rows between where you clicked and the last row you had selected will be selected. -
Disjointed select: With at least one row already selected, hold the
Commandkey down (Mac) (on Windows this is probably the Ctrl key) and click on an unselected row.
-
-
Multi-deselect:
-
Contiguous deselect: Hold the
Shiftkey down and click on a selected row. Any selected rows between where you clicked and the last row you had selected (inclusive) will be deselected. -
Disjointed deselect: Hold the
Commandkey down and click on a selected row. -
Deselect everything except current row: Click on any row without using the
ShiftorCommandkey. All other rows except for the current row will be deselected.
-
The following image shows the Results Table with the first row selected.
Path highlight
If a row contains a Path, then some special formatting will be applied to the Graph Visualization when that row is selected:
-
Path start node: the node that starts the path will be highlighted with a lighter color of the same hue
-
Path end node: the node that ends the path will be lowlighted with a darker color of the same hue
The following image shows the path highlight:
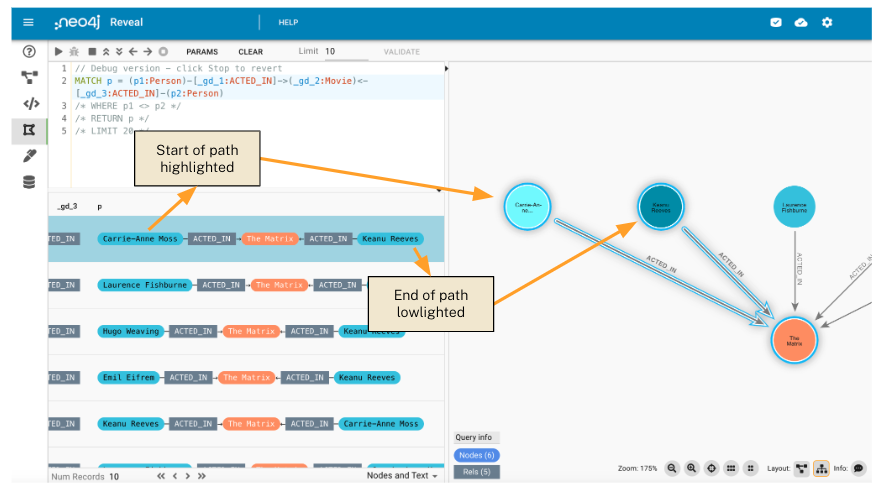
The image shows Carrie-Anne Moss highlighted as the start node for the selected row. Keanu Reeves is lowlighted because it is the end node.
This is useful because it helps to visualize situations where the same path is returned in reverse. For instance, four rows below the selected row, the same path is returned in reverse - Keanu Reeves is the start node and Carrie-Anne Moss is the end node.
The rows came from running this query:
MATCH p=(p1:Person)-[:ACTED_IN]->(:Movie)<-[:ACTED_IN]-(p2:Person)
WHERE p1 <> p2
RETURN p
LIMIT 20
To fix the problem of both a path and a reverse path from being returned, the WHERE clause could be updated to this:
WHERE id(p1) < id(p2)This will elimate the reverse paths.