Results
Whenever a query is Run or a Debug step is executed, Results are shown either in the Graph Visualization panel, the Results Table panel, or both.
Reveal uses the Neo4j Javascript driver to execute Cypher queries. The Javascript driver returns results as a series of records. These records correspond to the RETURN clause of the Cypher statement that was executed. The Records are displayed in both a Graph Visualization form and a Table form.
Note: We will use the terms rows and records interchangeably as we discuss the display of the returned results.
Graph Visualization
The Graph Visualization shows the returned nodes, relationships, and paths. The screenshot below shows an example:
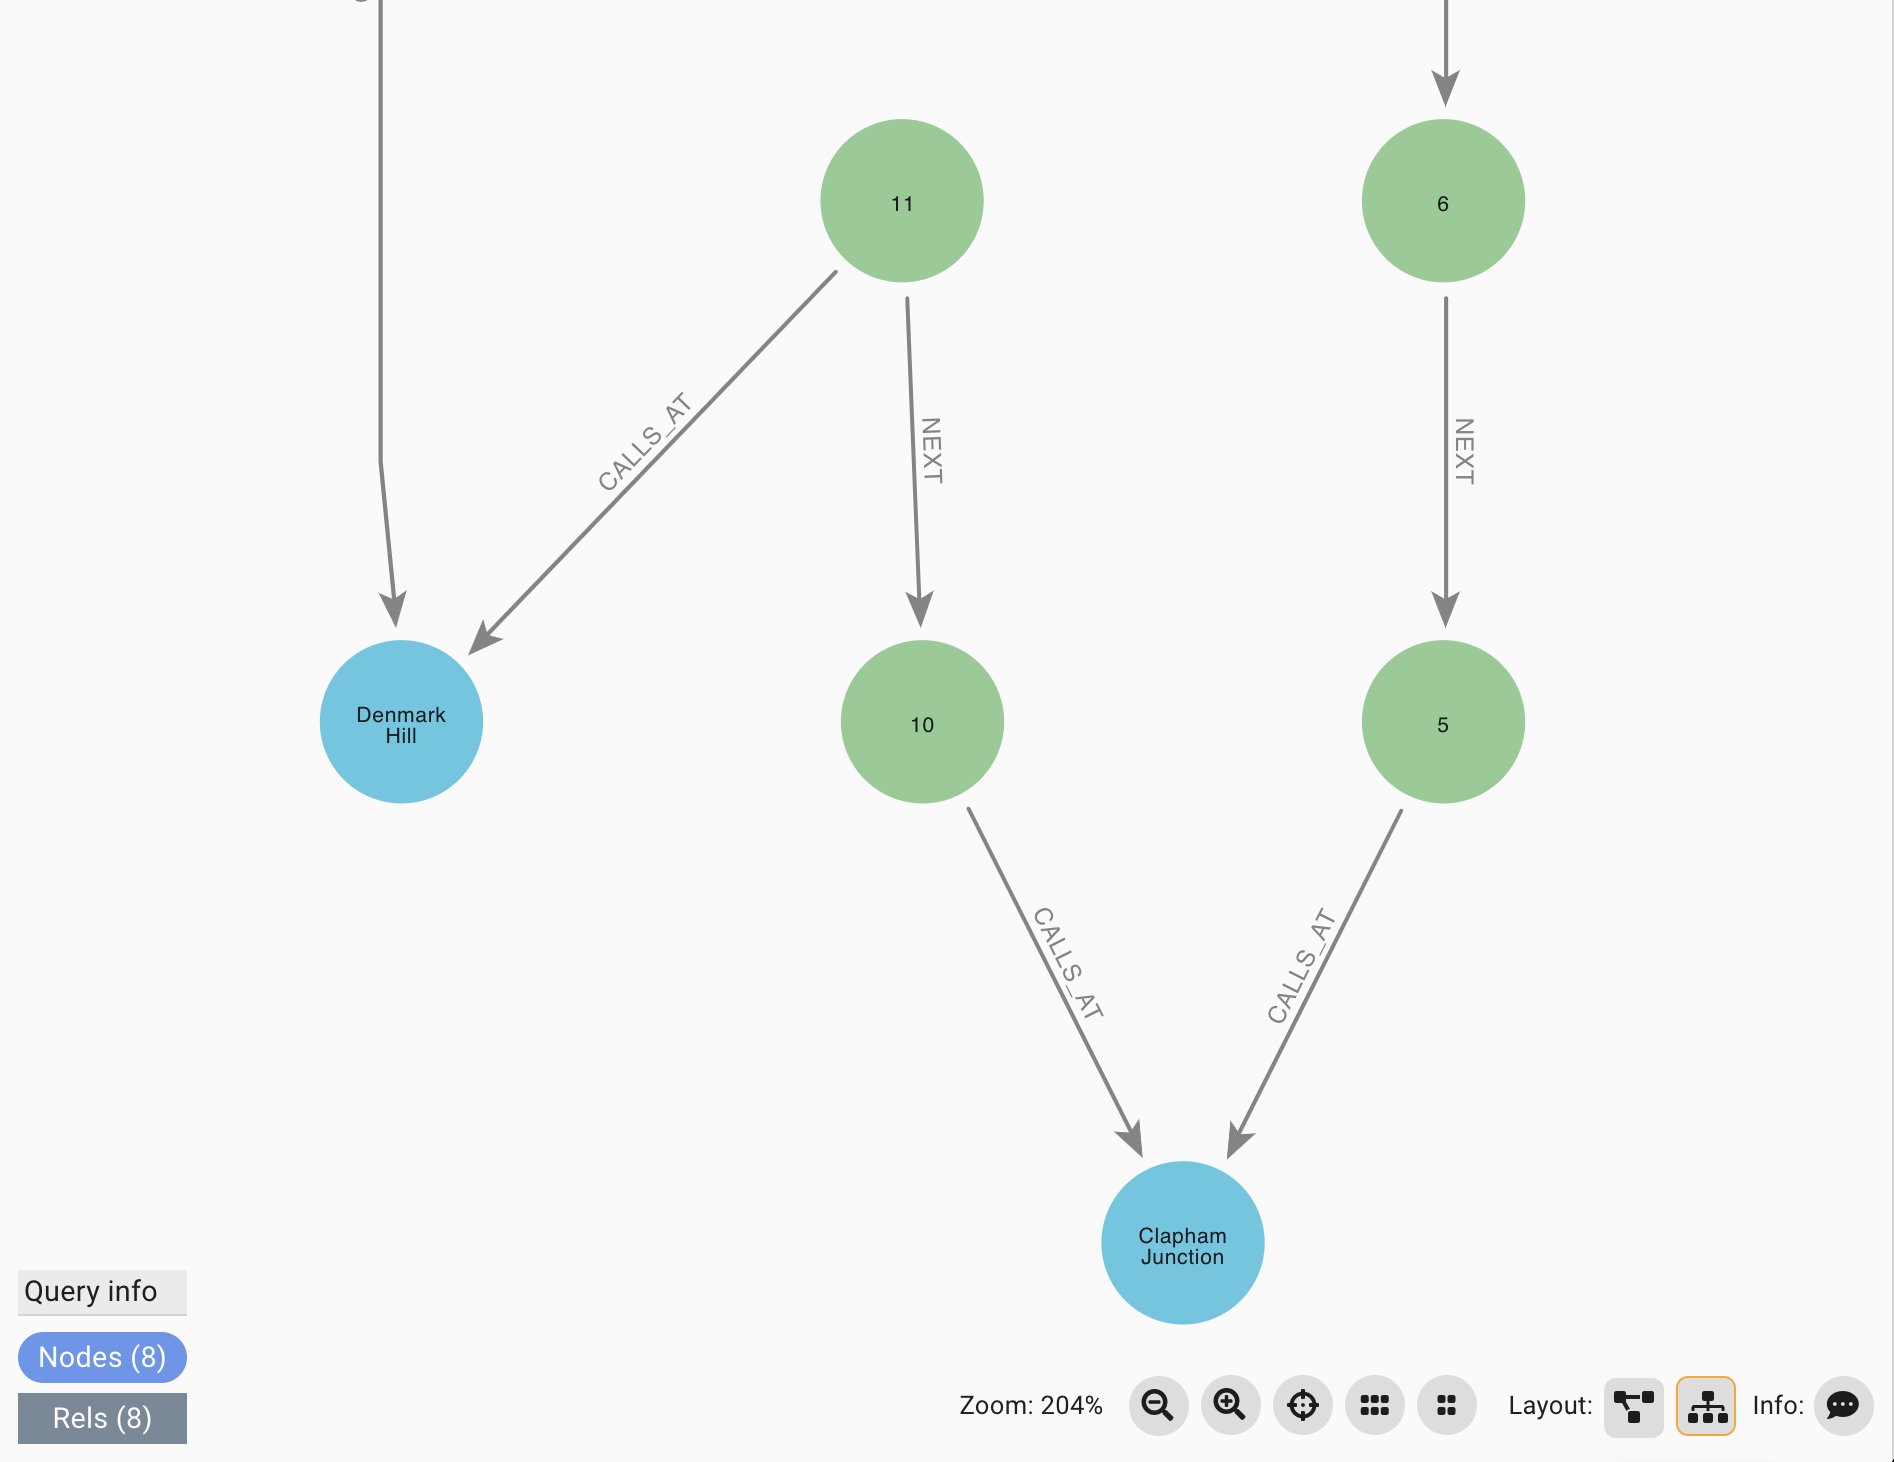
Any Node, Relationship, or Path that is contained in a result row will be displayed in the graph visualization (also called a scene). Scalar values such as Strings and Numbers are not displayed in the scene. If a Node, Relationship, or Path appears in multiple rows, it will only be displayed once in the scene.
You can pan and zoom the scene, and select nodes and relationships for inspection. See Graph Visualization for further details.
Results Table
The Results Table shows each record returned from the Javascript driver. All data types - Nodes, Relationships, Paths, Scalar values, Lists, and Maps - are displayed in the results table.
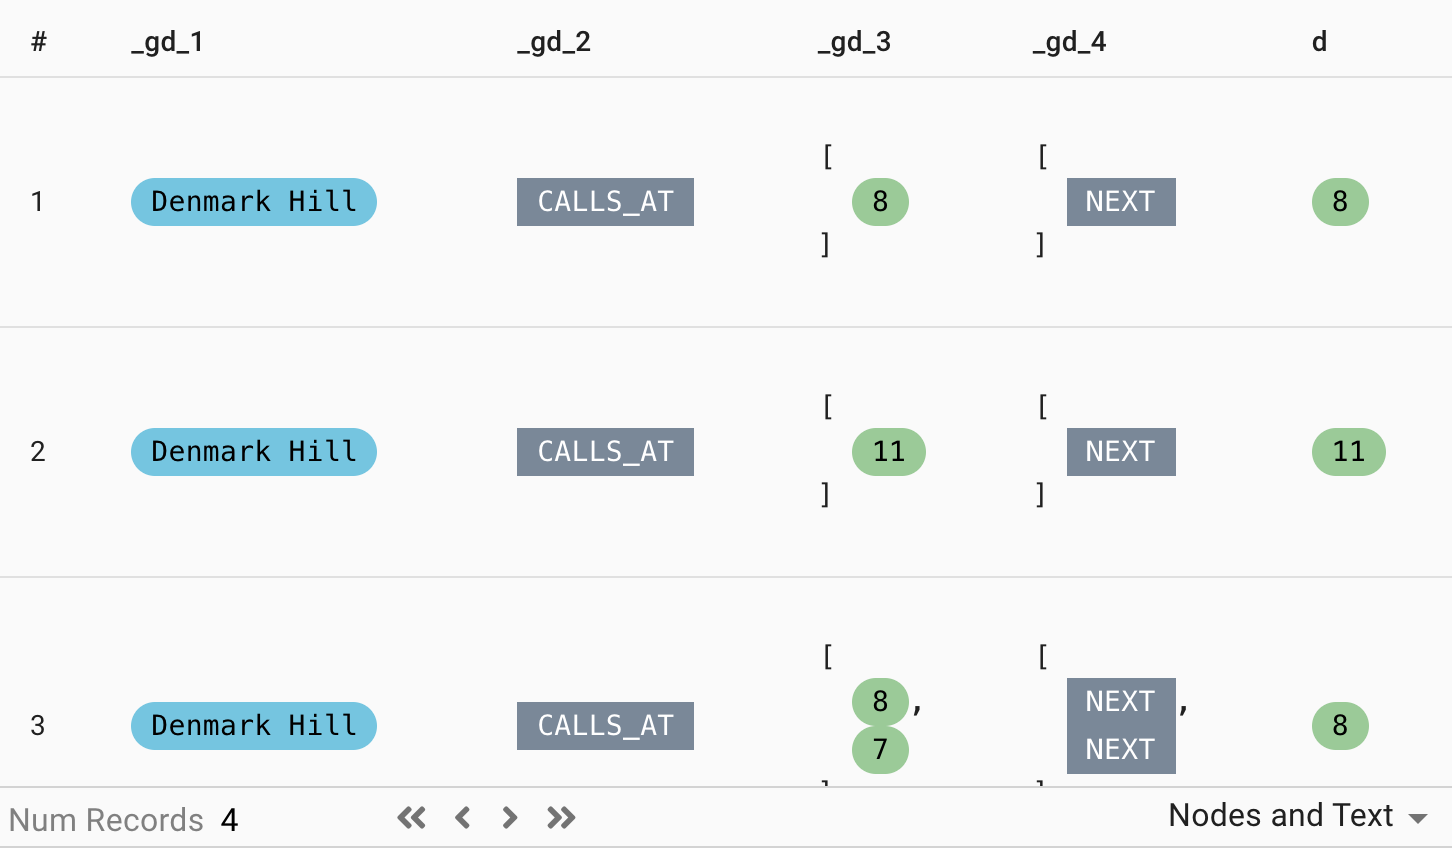
Nodes, Relationships, and Paths are shown using colored bubbles and rectangles by default. Their display can be changed by changing the display mode. Scalar values, Lists, and Maps are displayed as-is, with whitespace formatting depending on the display mode.
You can select one or more rows in the Results Table. All Nodes, Relationships, and Paths in selected rows will be selected in the Graph Visualization.
See Results Table for further details.
Panels
The Graph Visualization and Results Table panels can be resized and collapsed.
-
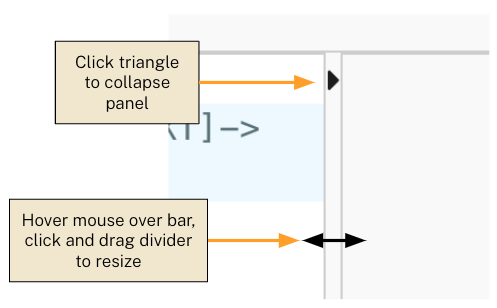
Resizing: Resize the panel by hovering your mouse over the divider until the double arrow cursor appears. Once the double arrow cursor appears, click and drag the divider to resize the panel.
-
Collapsing: Click on the small triangle in the divider to collapse the panel.
-
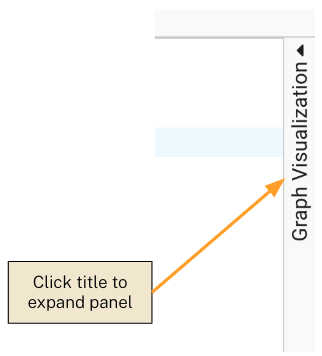
Expanding: Click on the collapsed panel’s title or arrow to expand it to its previous location.