Graph Visualization
Overview
The Graph Visualization shows the returned nodes, relationships, and paths from executing a Cypher query. Reveal uses the Neo4j Visualization Library, or NVL for short, to visualize nodes and relationships.
The image below shows the different sections of the Graph Visualization:
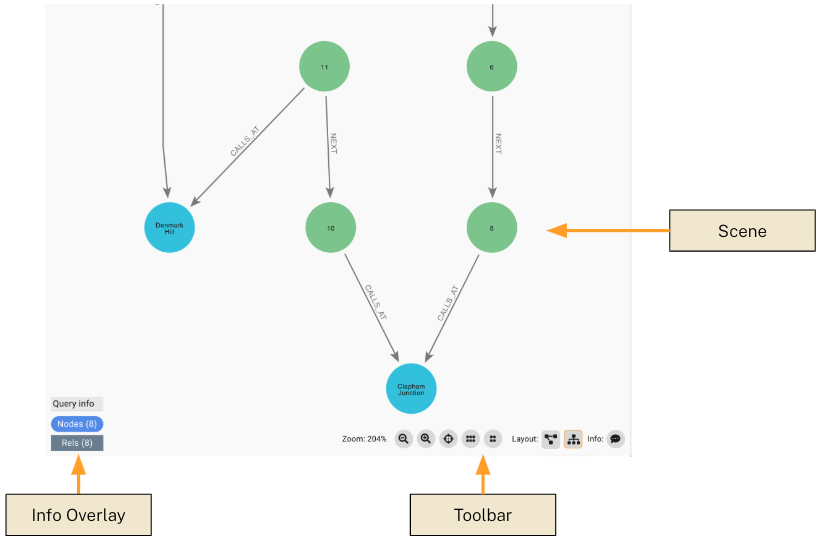
The Graph Visualization is composed of the following areas:
-
Scene: the canvas where nodes and relationships are drawn
-
Info Overlay: contains relevant information for the scene or database
-
Toolbar: buttons to manipulate the scene
As you step through a Cypher statement in Debug mode, the nodes and relationships in the scene will change depending if they are new to the scene, already exists in the scene, or are removed from the scene:
-
New: Will be added to the visualization with a Selection highlight. A Selection highlight is a colored outline drawn around a node or relationship to show that it is selected.
-
Existing: Selection highlight will be removed if present.
-
Removed: Removed from visualization.
After nodes and relationships are added, the visualization will be automatically layed out according to the currently selected layout.
Placeholder Nodes
Occassionally smaller grey placeholder nodes will be drawn. This occurs when you have stepped far enough to return a source node and a relationship, but not the end node. In this case, since the end node has not been fully returned, a placeholder with its id is rendered.
For instance, if you returned this:
MATCH (p:Person)-[r:ACTED_IN]->() RETURN p, rYou will see gray placeholder nodes for the end node of ACTED_IN.
If you prefix the MATCH with a path variable like this:
MATCH path=(p:Person)-[r:ACTED_IN]->() RETURN p, rYou won’t see placeholder nodes as you step through the query, because the path variable includes information about the end node, and path will be returned if you are debugging. However, at the end of the query, since you aren’t returning path and only p and r are returned, the placeholder nodes will appear in the final result.
Interacting with the Scene
Mouse and Touchpad terminology
The instructions here will use the term click to refer to either a mouse click or a single tap on a touchpad. In general, mouse terminology will be used, but the equivalent operations on a touchpad should work as well.
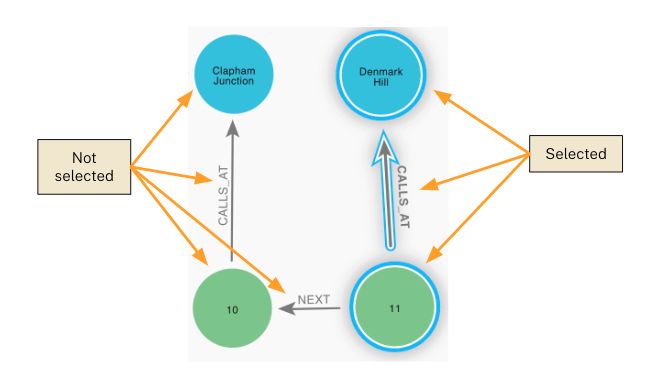
Selecting / Deselecting
Nodes and relationships can be selected. A selected node or relationship has a colored outline drawn around it. Use the following mouse or touchpad operations to select and deselect items:
-
Select: Single click on an unselected item
-
Deselect: Single click on a selected item
-
Deselect everything: Click on the scene background
Note: currently there is no keyboard support for multi-select, nor is there a way to draw a rectangle around a number of nodes to select them. This may be added in a future release.
Scene toolbar
The bottom of the scene contains a toolbar as shown in the diagram below.
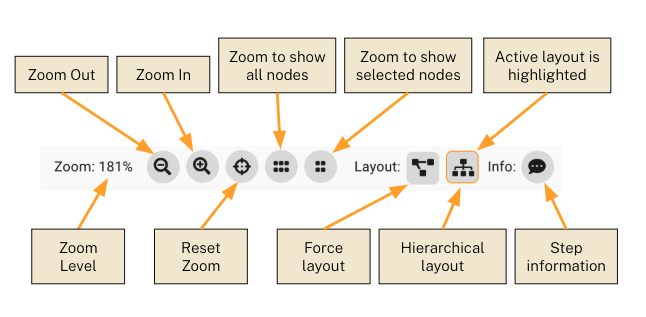
The diagram calls out what each button does, but they are re-listed here for clarity:
Zoom
The zoom section shows the current zoom level followed by five buttons:
-
Zoom out: Zoom out to show more information in the scene.
-
Zoom in: Zoom in to focus on nodes and relationships.
-
Reset zoom: Resets to the default zoom, which is 200%.
-
Zoom to show all nodes: Will zoom out until all nodes in the scene are visible.
-
Zoom to show selected nodes: Will zoom out until all selected nodes in the scene are visible.
You can also Zoom in and Zoom out using the mouse wheel or equivalent operation on a touchpad.
Layout
There are two layouts available:
-
Force directed: lays out nodes by pushing them away from each other to give them space
-
Hierarchical: lays out nodes top-to-bottom in a tree layout
The layout that is active has a small orange border around its button. As nodes or relationships are added, the active layout is automatically run.
Info
This button will show the Cypher piece that was just executed.
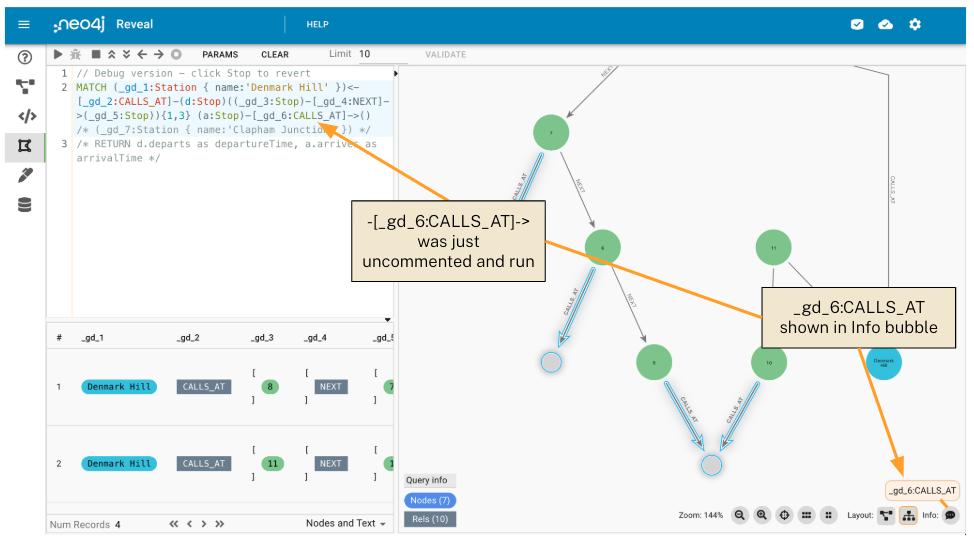
The diagram shows that when stepping forward, -[_gd_6:CALLS_AT]→ was just uncommented and added to the active query. The Info button bubble shows _gd_6:CALLS_AT to show the Cypher for the last step (it shows the last step you would get by using the Step forward inside line or Step backward inside line).
Info Overlay
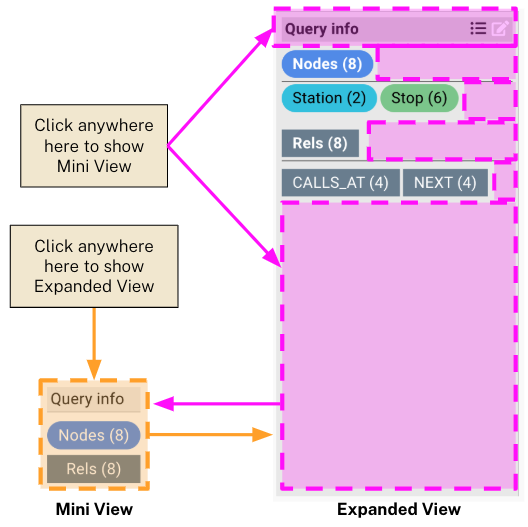
The Info Overlay exists in the lower-left of the Graph Visualization. It toggles between a Mini View and an Expanded View. The information displayed will change depending if you just connected to the database, you are running a query, or have items selected in the scene.
Toggle between Mini View and Expanded View
If you click anywhere in the Mini View, it will expand and show you the Expanded View.
If you click on the title bar, or the gray background of the Expanded View, it will collapse and show you the Mini View.
See this diagram for more clarity:
Mini View
The Mini View toggles between three modes:
-
Database Info: The title shows the name of the currently connected database. It also provides a count of the all nodes and relationships in the database.
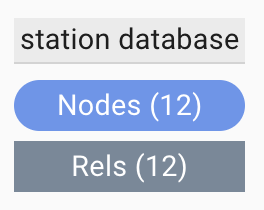
The Database Info will be shown after you connect to a database, or you click the Clear button.
-
Query Info: The title says
Query Info. It shows a count of all nodes and relationships in the scene.
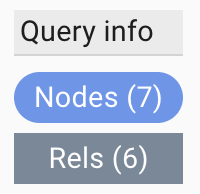
Query Info will be shown when you are executing or stepping through a query, you have not selected any nodes or relationships by clicking, or you have cleared selected items by clicking the scene background.
-
Selected Info: The title says
Selected Info. It shows a count of all selected nodes and relationships in the scene.
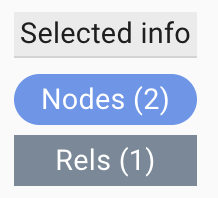
Selected Info will be shown when you are executing or stepping through a query, and you have specifically clicked on one or more items in the scene.
Expanded View
The Expanded View also has three modes:
-
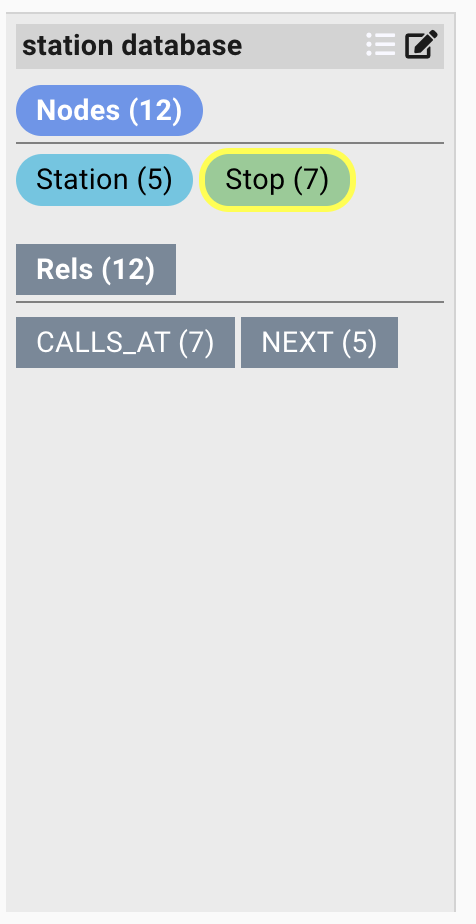
Database Info: Shows all node labels and relationship types along with their count in the currently connected database.
-
Query Info: Shows the active node labels and relationship types along with their count in the active scene.
You may also see More… displayed below the listed node labels and relationships types. Clicking on More… will show any node labels or relationship types that are present in the database but are not present in the current scene. This can be useful if you want to configure the color or display label for nodes of that type. If you click More… you can click …Less to hide the extra information.
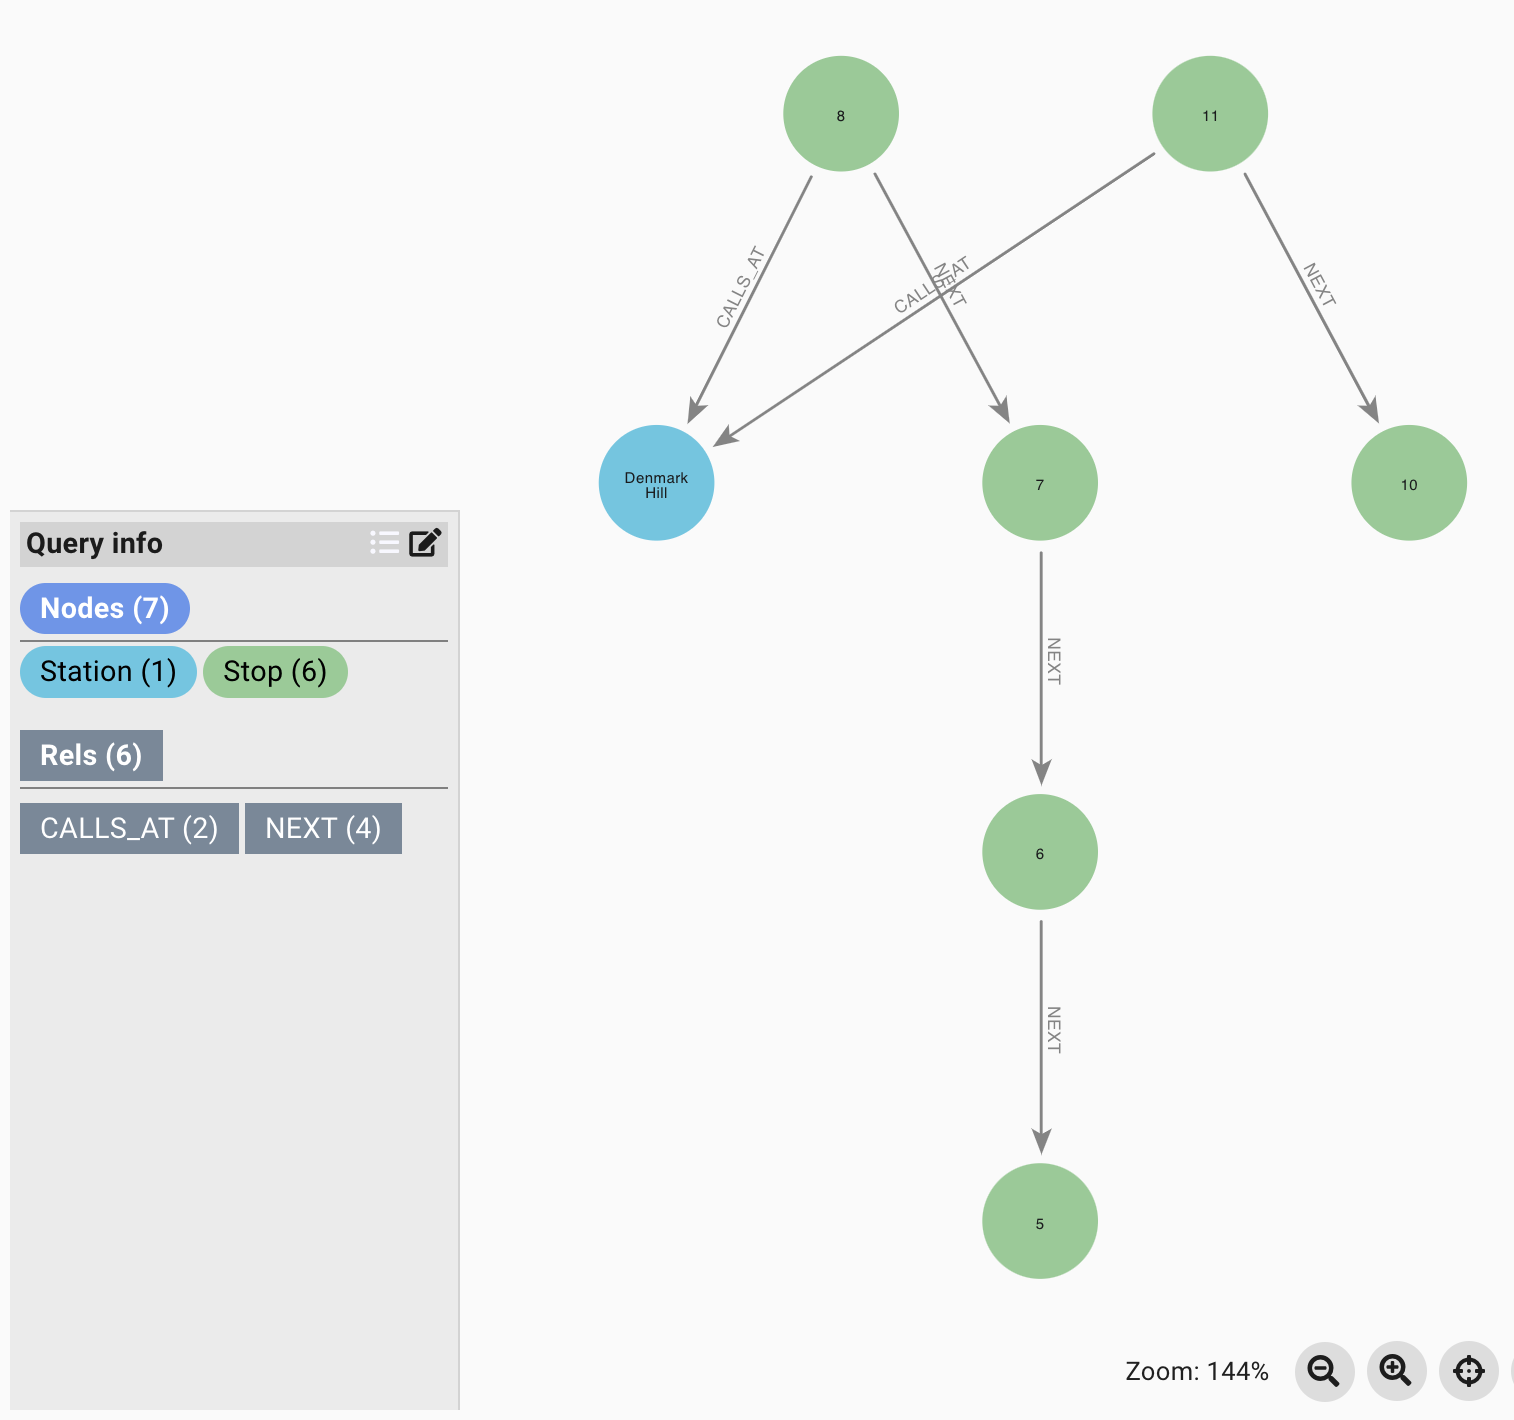
The diagram above shows that there is one Station node, six Stop nodes, two CALLS_AT relationships, and four NEXT relationships.
-
Selected Info: Shows the selected node labels and relationship types along with their counts in the active scene.
Item Properties
You can view the properties of nodes and relationships in the scene. To do this, follow these instructions:
-
Make sure you are in Expanded View
-
Select a node or relationship in the scene
-
Ensure that the
Show Propertiesbutton is selected in the Expanded View title bar
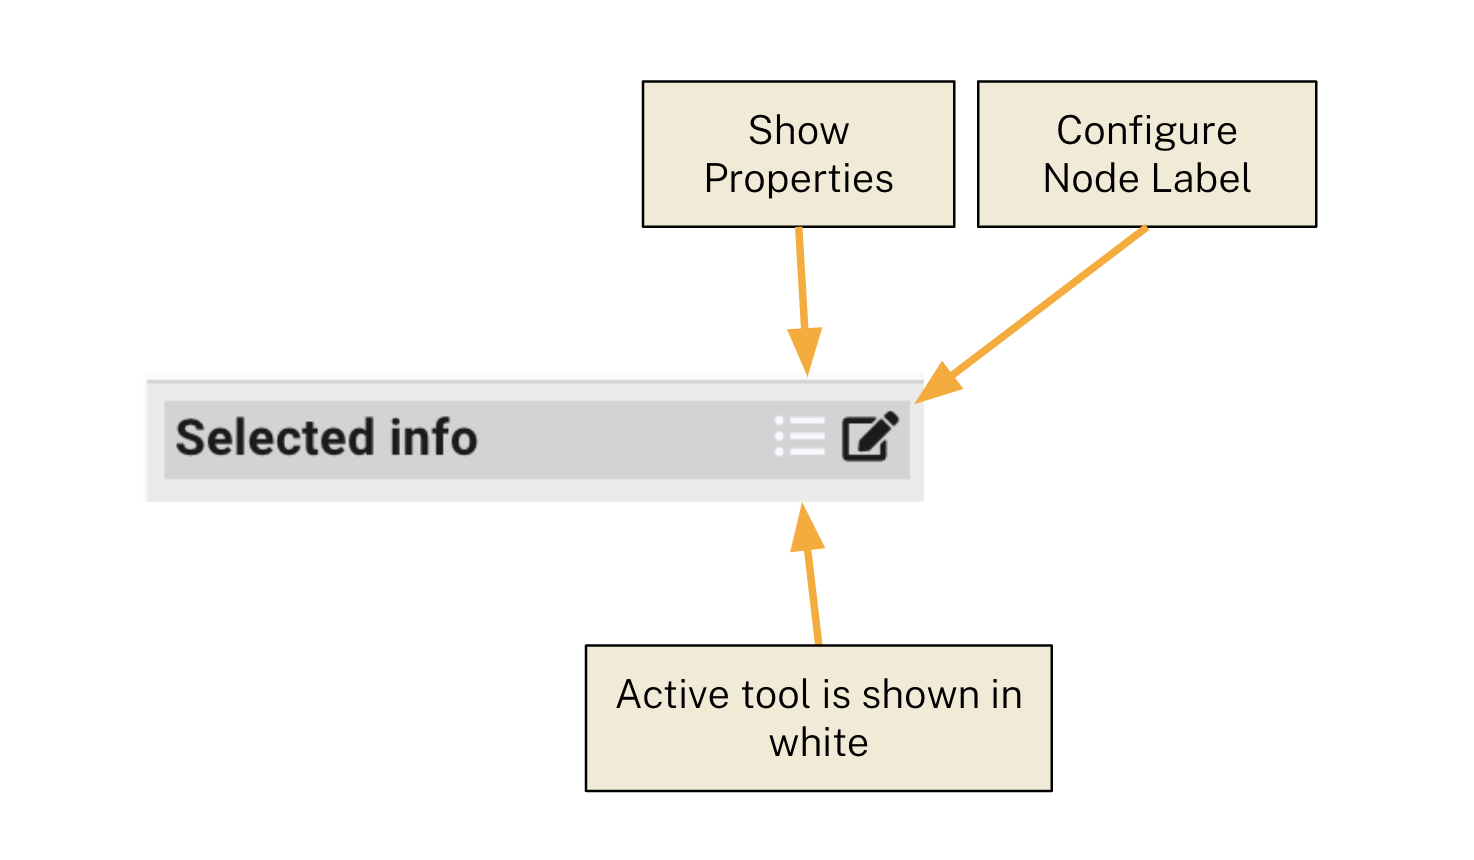
The above image shows the Show Properties button is currently selected.
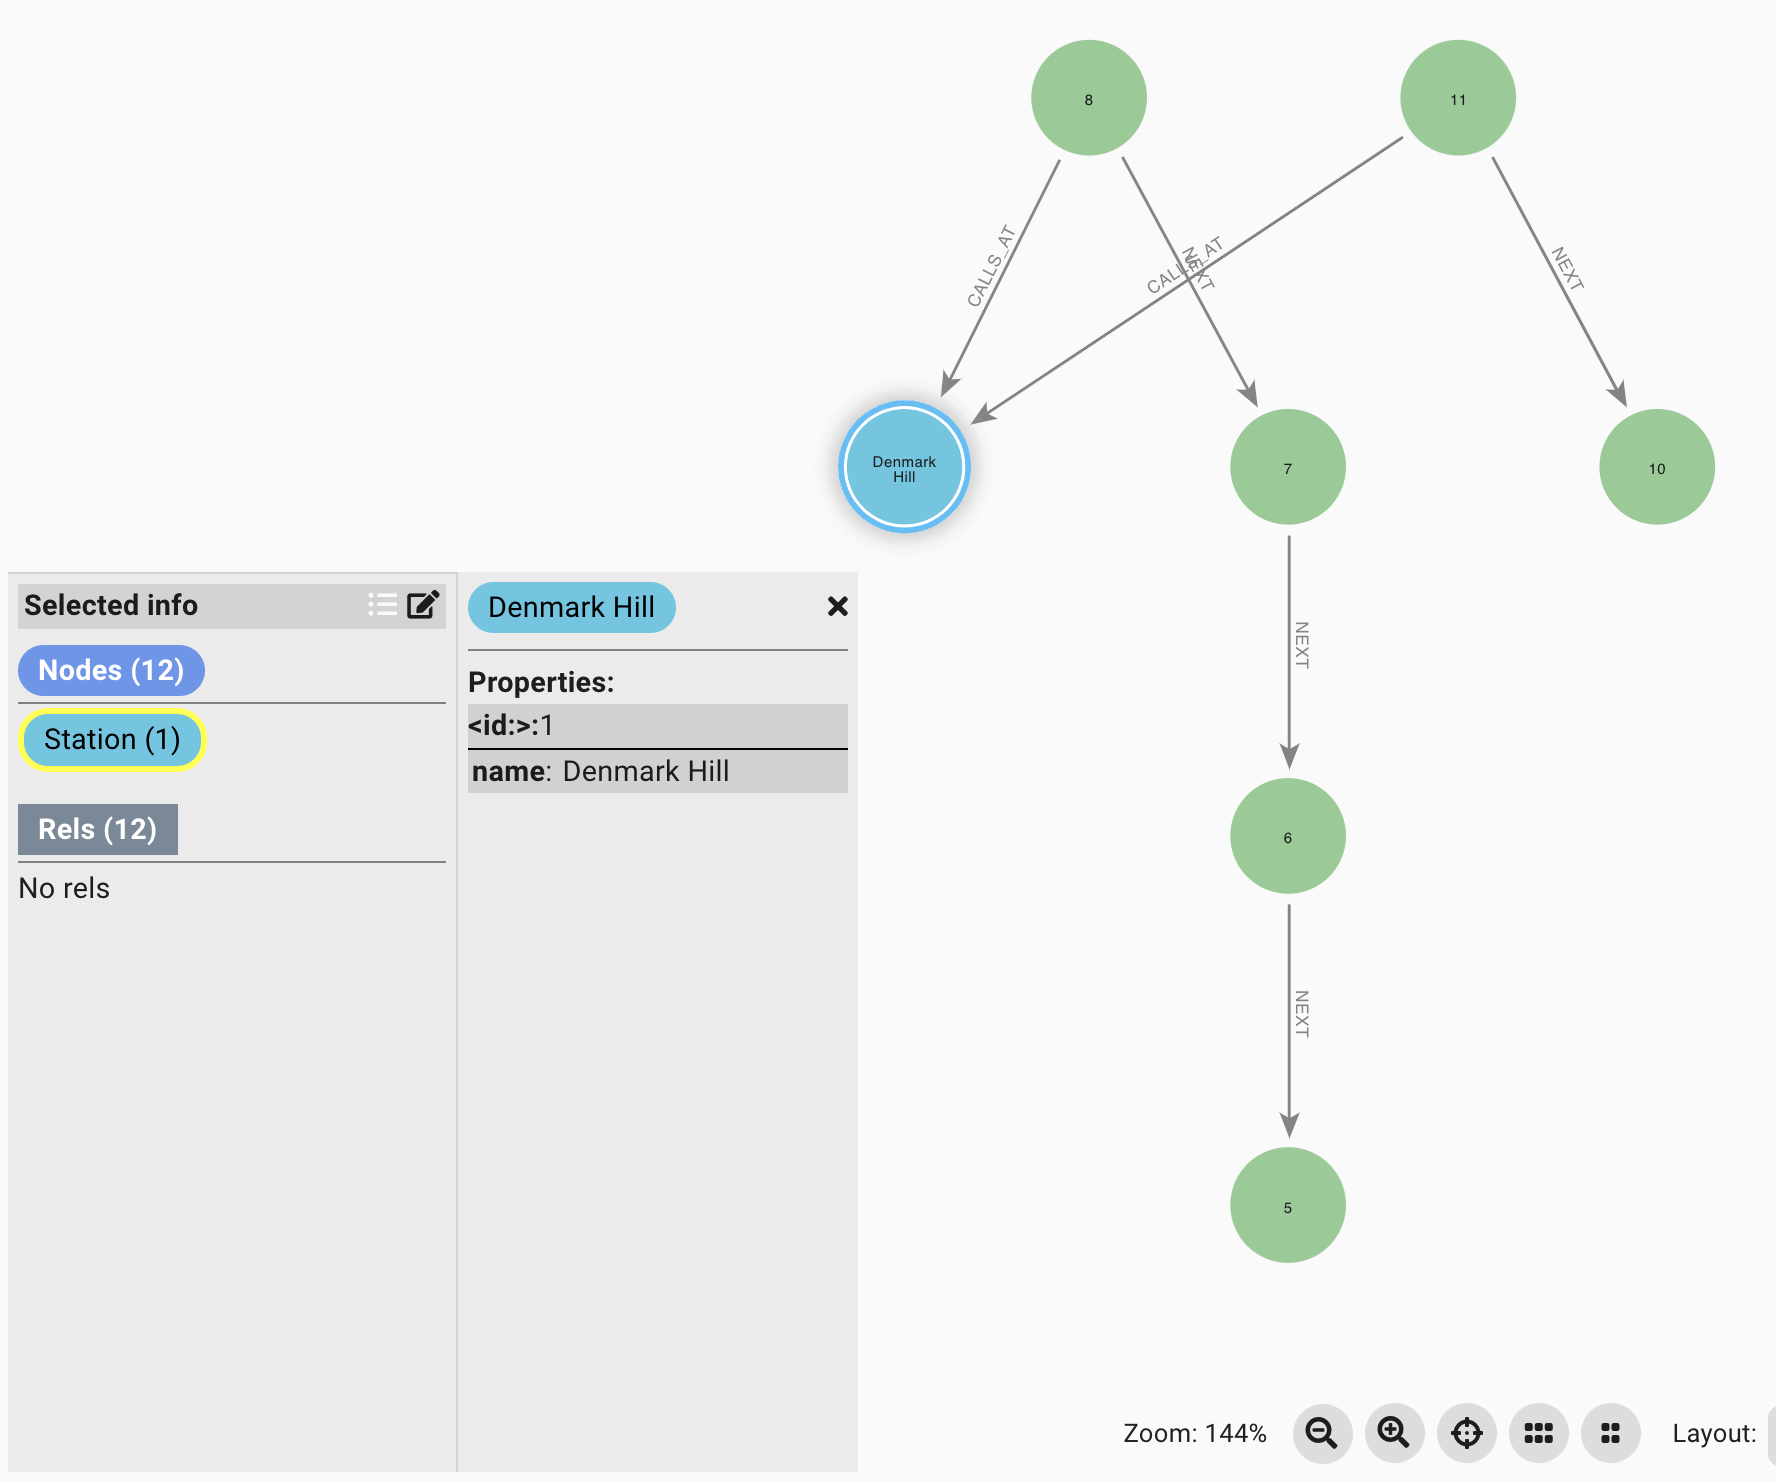
The toolbar buttons will toggle the display of a pop-out panel. If the panel is closed, it will be opened, if the panel is open, it will be closed. The following diagram shows the properties for the selected Station node in the scene.
Configuration
You can configure the colors and display labels of the nodes using the Expanded View. See this link for more information Configure colors and labels.